
In the spectrum of a tone, there are a few important features to note. The first feature is that the delta between the amplitude of the main lobe and the amplitude of the side lobe next to the main lobe is 13.3dB. The second feature is that the width of the main lobe is 2/T. In this case, 2/T=200Hz. These features can be used for tone evaluation. For example, if the amplitude delta between the main lobe and the side lobe is larger than 13.3dB, this often means the tone is corrupted by a windowing function which can increases the amplitude delta.

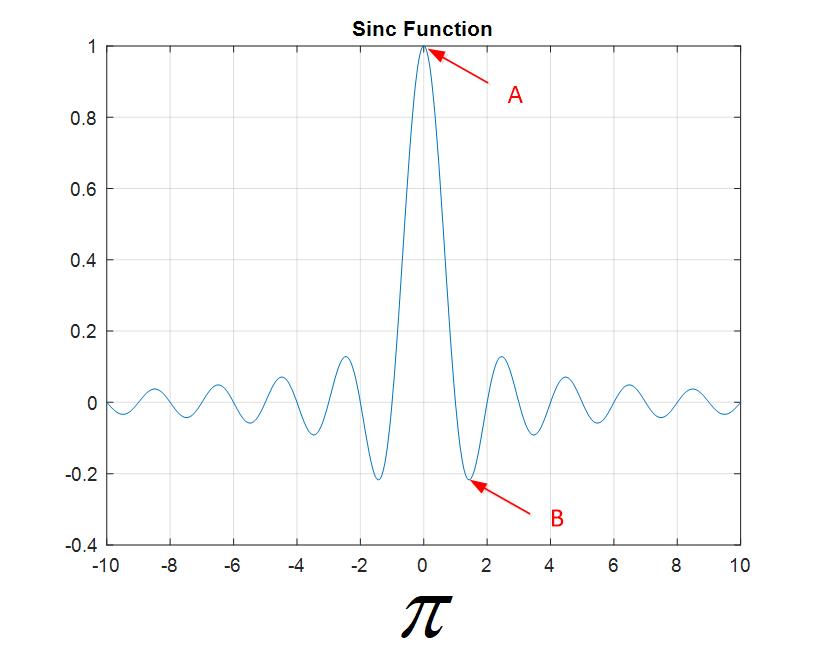
Both features can be explained by the relationship between rectangle waveform and sinc function. A tone with limited duration can be seen as imposing a rectangular window on a tone signal with infinite duration. If the tone signal has infinite duration, in spectrum it will show as an impulse. For a tone with limited duration, instead we will see a spectrum like above and this is due to frequency transform of a rectangular window in time domain. From signal processing 101, we know that a rectangular window in time domain can be transformed into a sinc function in frequency domain. sinc(x) = sin(x)/x. sinc(0) = 1 and it corresponds to the max amplitude of the main lobe (point A in the plot below). Point B corresponds to the max amplitude of the first side lobe in the spectrum. At point B, derivative of sinc(x) is 0. By numerical method, x point B can be found as 4.4934 (note that the x-axis of sinc function plot is scaled by Pi). And thus we find that the amplitude delta between point A and point B is exactly 13.3dB.
No comments:
Post a Comment